Search results
Search for "Auger parameter" in Full Text gives 2 result(s) in Beilstein Journal of Nanotechnology.
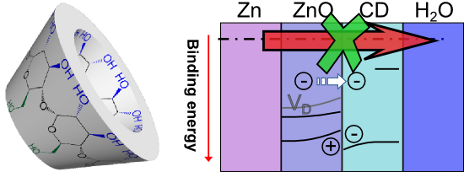
Cyclodextrin inhibits zinc corrosion by destabilizing point defect formation in the oxide layer
Beilstein J. Nanotechnol. 2018, 9, 936–944, doi:10.3762/bjnano.9.86
- from impurities collected through the sample transfer. Due to the high symmetry of the Zn 2p3/2 peak, analysis of the Auger parameter α was needed to understand the electronic structure of the layer (Figure 3c). Figure 3d shows the Zn 3d region, including an inset with the depth dependence of the ZnO
- interfacial energy levels of oxidized Zn was obtained from comparing the kinetic energy Ekin(jkl) of the main Auger transition jkl, here Zn LMM, with the binding energy EB(i) of a photoelectron from the main atomic level i, here Zn 2p [44][45] as The Auger parameter α is a measure in the differences in
- ) Zn 2p3/2, (d) Zn 3d - valence band (VB) energy region, with ZnO VB onset and ZnO VB maximum as functions of the TOA (inset). (e) Binding-energy variations for recorded spectral regions with TOA; (f) UPS HOMO onset of β-CD recorded with He II excitation. The Auger parameter α is shown as inset in (c


CoPc and CoPcF16 on gold: Site-specific charge-transfer processes
Beilstein J. Nanotechnol. 2014, 5, 524–531, doi:10.3762/bjnano.5.61

- allow the discussion of site-specific charge-transfer processes. Keywords: Auger parameter; charge transfer; interfaces; organic semiconductors; photoemission; phthalocyanines; polarization screening; Introduction In order to develop and improve the performance of organic-based electronic devices an
- change of the modified Auger parameter α’ is monitored according to Δα’ = ΔEB(XPS) + ΔEkin(XAES) (Ekin corresponds to the kinetic energy). On the other hand, the modified Auger parameter α’ is correlated to the dynamical or one-hole relaxation energy RD (Δα´≈ 2·ΔRD) and thus to the electronic
- state [5][19]. On the other hand, in case of fluorinated Pcs the absence of a local charge transfer process at the fluorine atom allows the estimation of the polarization screening via the corresponding Auger parameter [19]. In Figure 2 we discuss F 1s core level spectra (Figure 2a) and F KLL Auger


Other Beilstein-Institut Open Science Activities